R has well-supported classes for storing spatial data (sp) and interfacing to the above mentioned environments (rgdal, rgeos), but has so far lacked a complete implementation of simple features, making conversions at times convoluted, inefficient or incomplete. The package sf tries to fill this gap, and aims at succeeding sp in the long term. However This is a Huge topic to cover that we need a separate book for this.
We’ll just give you a brief overview of how to plot maps using sf and ggplot2.
── Attaching core tidyverse packages ──────────────────────── tidyverse 2.0.0 ──
✔ dplyr     1.1.4     ✔ readr     2.1.5
✔ forcats   1.0.0     ✔ stringr   1.5.1
✔ lubridate 1.9.3     ✔ tibble    3.2.1
✔ purrr     1.0.2     ✔ tidyr     1.3.1
── Conflicts ────────────────────────────────────────── tidyverse_conflicts() ──
✖ dplyr::filter() masks stats::filter()
✖ dplyr::lag()    masks stats::lag()
ℹ Use the conflicted package (<http://conflicted.r-lib.org/>) to force all conflicts to become errors
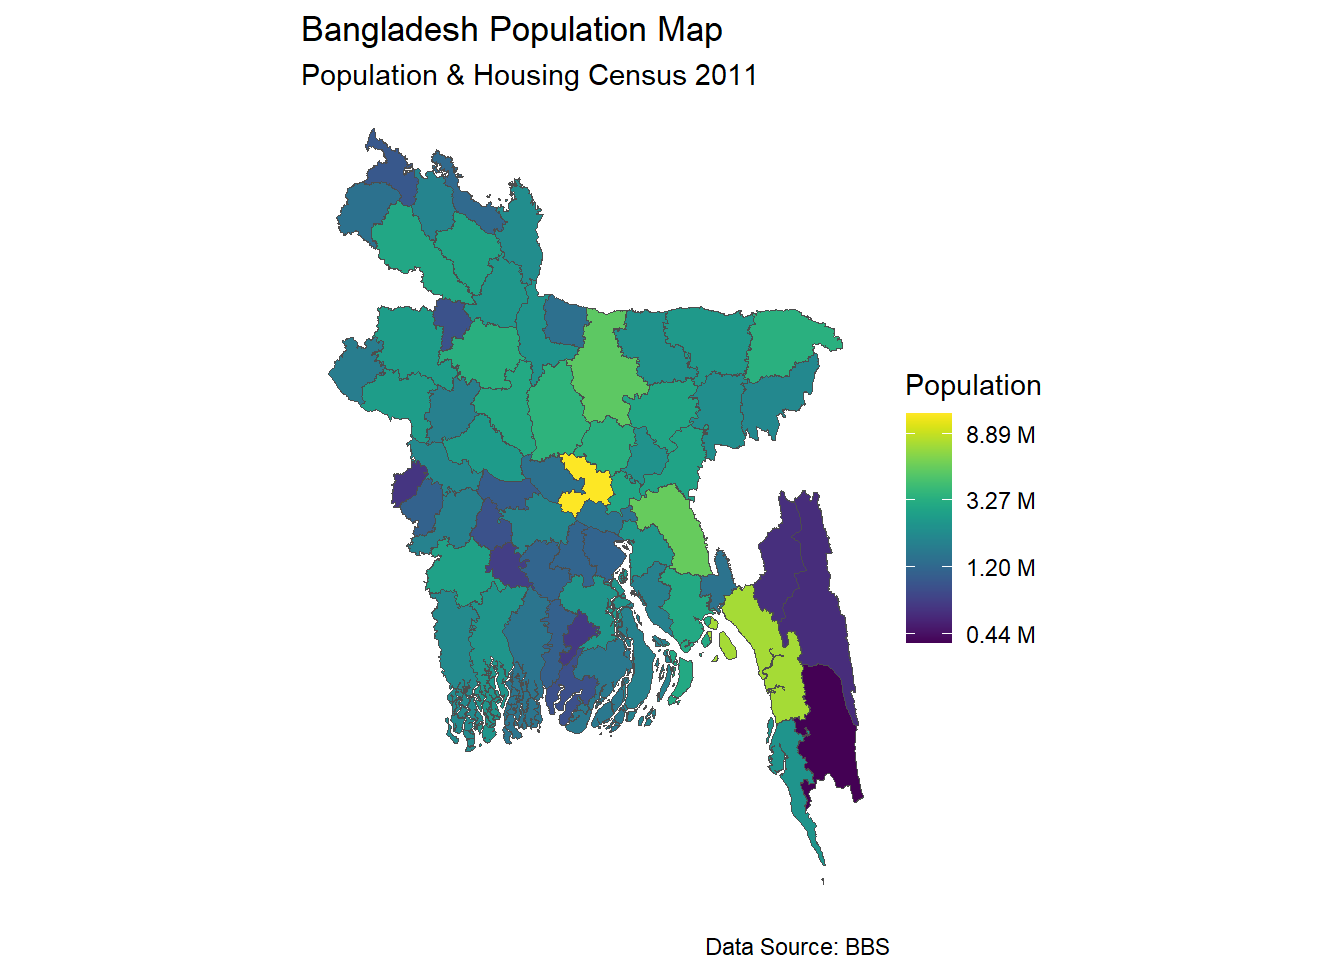
# Get map data, join with population data, and plot in a single pipelinedata <-get_map("district") %>%left_join(bangladesh::pop_district_2011[, c("district", "population")], by =c("District"="district"))pp <- data %>%ggplot() +geom_sf(aes(fill = population), col ="grey30") +theme_void() + viridis::scale_fill_viridis(trans ="log", name="Population", labels = scales::unit_format(unit ="M", scale =1e-6)) +labs(title ="Bangladesh Population Map",subtitle ="Population & Housing Census 2011",caption ="Data Source: BBS" )pp
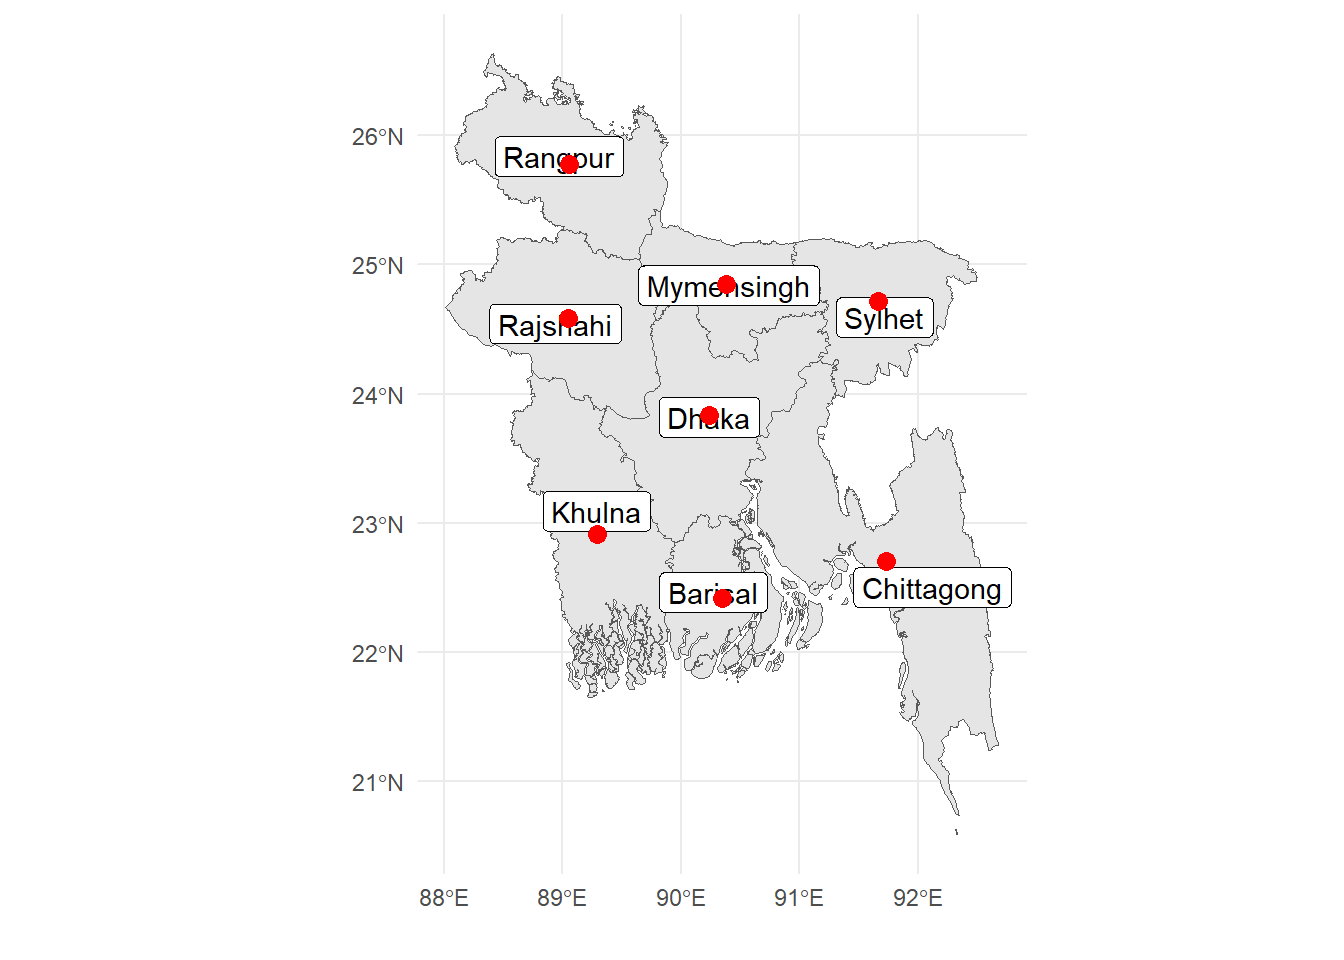
Here is another example:
division_data <-get_map("division")division_centroids <- bangladesh::get_coordinates(level ="division")ggplot(data = division_data) +geom_sf() +geom_sf_label(aes(label = Division)) +geom_point(data = division_centroids, x = division_centroids$lon, y = division_centroids$lat, col ="red", size =3) +xlab("")+ylab("")+theme_minimal()
Warning in st_point_on_surface.sfc(sf::st_zm(x)): st_point_on_surface may not
give correct results for longitude/latitude data
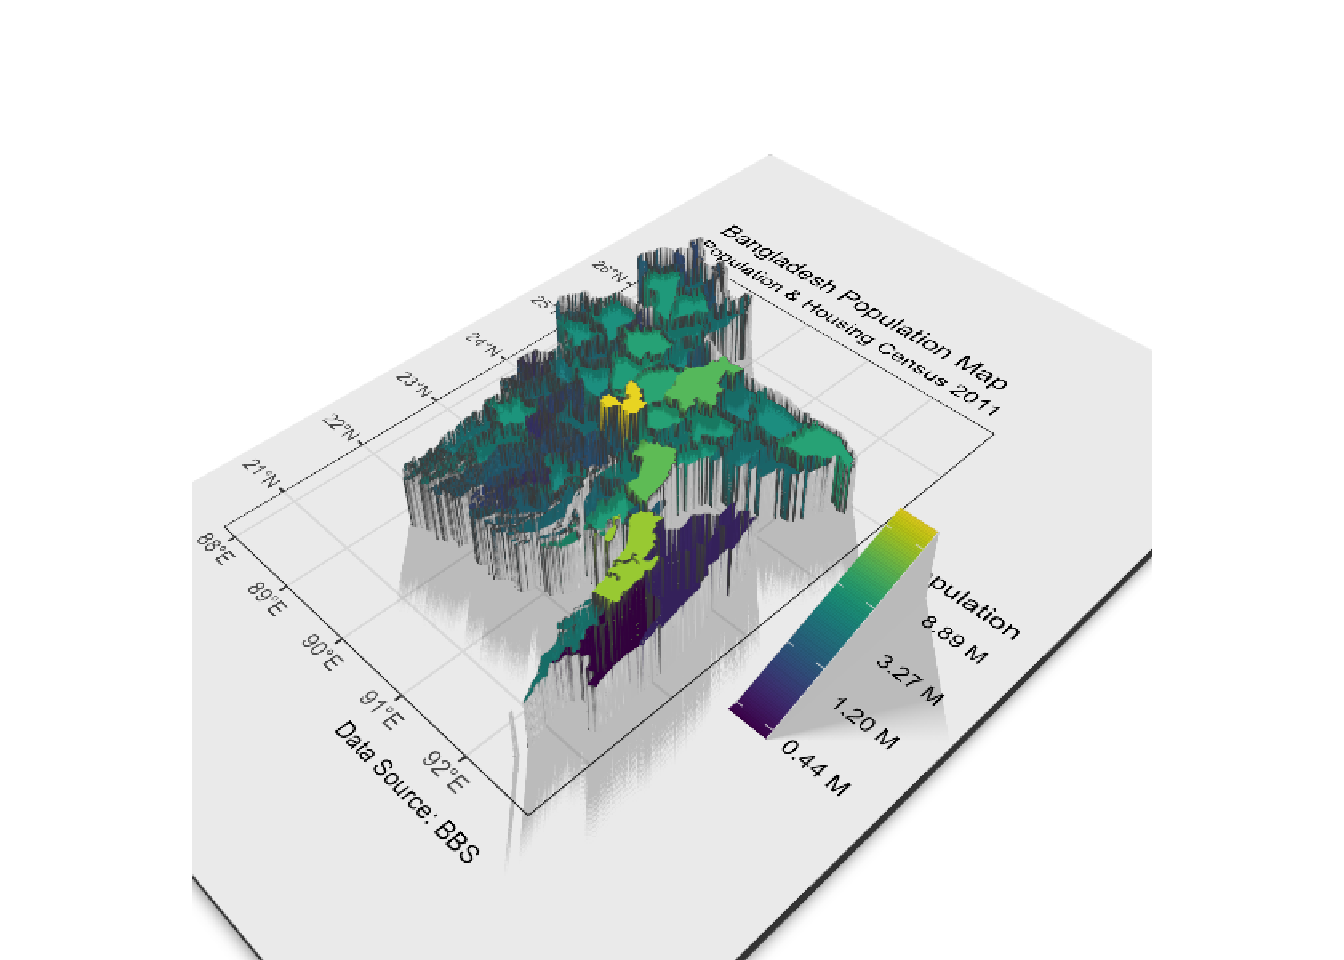
You can also make 3D map using rayshadersf and ggplot2 package. Here is an example:
The field of geographical data analysis is a vast and ever-evolving domain, offering an array of techniques and tools to explore and understand spatial data. In this book, we have provided a glimpse into the fascinating world of Data Visualization using ggplot2 and introducing you to the fundamental concepts and methods that form the foundation of spatial analysis.
While we have covered a range of topics, it is important to recognize that this is merely the tip of the iceberg. Geographical data analysis encompasses a multitude of specialized areas, each with its own unique challenges and solutions. As we continue our journey through this field, we are working on a dedicated book that will delve deeper into the intricacies of geographic data analysis.
In this forthcoming work, we will explore in greater depth the realm of shapefiles, a crucial data format for representing geographical features. Additionally, we will dive into the powerful capabilities of the sf package, which provides a comprehensive set of tools for working with spatial vector data in R.
Furthermore, we will introduce you to leaflet, a cutting-edge library that enables the creation of interactive web maps, allowing you to visualize and analyze spatial data in a dynamic and engaging manner. The rayshader package will also be explored, offering techniques for generating stunning 3D visualizations of geographical data, providing new perspectives and insights.
Another exciting area we will cover is the tmap package, a versatile tool for creating thematic maps and visualizing spatial patterns. With its rich set of features and extensive customization options, tmap empowers you to communicate your spatial data in a clear and compelling way.
Beyond these specific packages and techniques, we are actively engaged in the development of new and innovative tools for geographical data analysis. Our goal is to push the boundaries of what is possible, providing researchers, analysts, and practitioners with cutting-edge solutions to tackle complex spatial problems.
As we continue to explore the depths of this fascinating field, we invite you to stay tuned for our upcoming work. Together, we will embark on a journey of discovery, unlocking the full potential of geographical data analysis and shaping the future of spatial research and applications.