ggplot(chic, aes(x = date, y = temp)) +
  geom_point(color = "firebrick") +
  labs(x = "Year", y = "Temperature (°F)") +
  theme(plot.background = element_rect(fill = "gray60"),
        plot.margin = margin(t = 1, r = 3, b = 1, l = 8, unit = "cm"))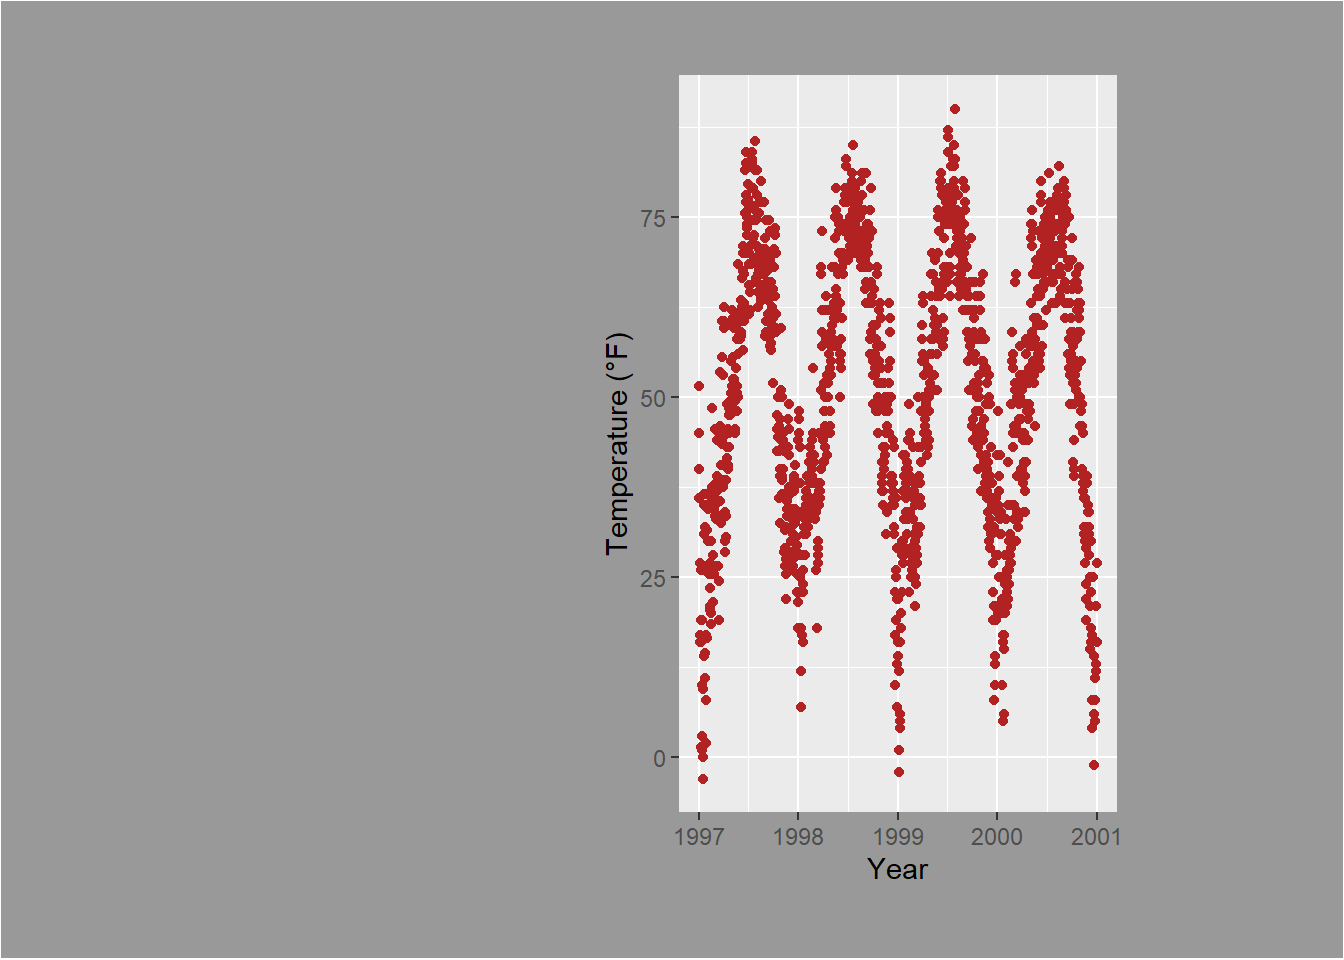
Sometimes it is useful to add a little space to the plot margin. Similar to the previous examples, we can use an argument to the theme() function. In this case, the argument is plot.margin. As illustrated in the previous example where we changed the background color using plot.background, we can now add extra space to both the left and right.
The plot.margin argument can handle a variety of different units (cm, inches, etc.), but it requires the use of the unit function from the package grid to specify the units. You can either provide the same value for all sides (easiest via rep(x, 4)) or particular distances for each. Here, I am using a 1cm margin on the top and bottom, 3 cm margin on the right, and an 8 cm margin on the left.
ggplot(chic, aes(x = date, y = temp)) +
geom_point(color = "firebrick") +
labs(x = "Year", y = "Temperature (°F)") +
theme(plot.background = element_rect(fill = "gray60"),
plot.margin = margin(t = 1, r = 3, b = 1, l = 8, unit = "cm"))
A helpful mnemonic for remembering the order of the margin sides is “t-r-ou-b-l-e”.
unit() instead of margin()
You can also use unit() instead of margin().
ggplot(chic, aes(x = date, y = temp)) +
  geom_point(color = "firebrick") +
  labs(x = "Year", y = "Temperature (°F)") +
  theme(plot.background = element_rect(fill = "gray60"),
        plot.margin = unit(c(1, 3, 1, 8), "cm"))